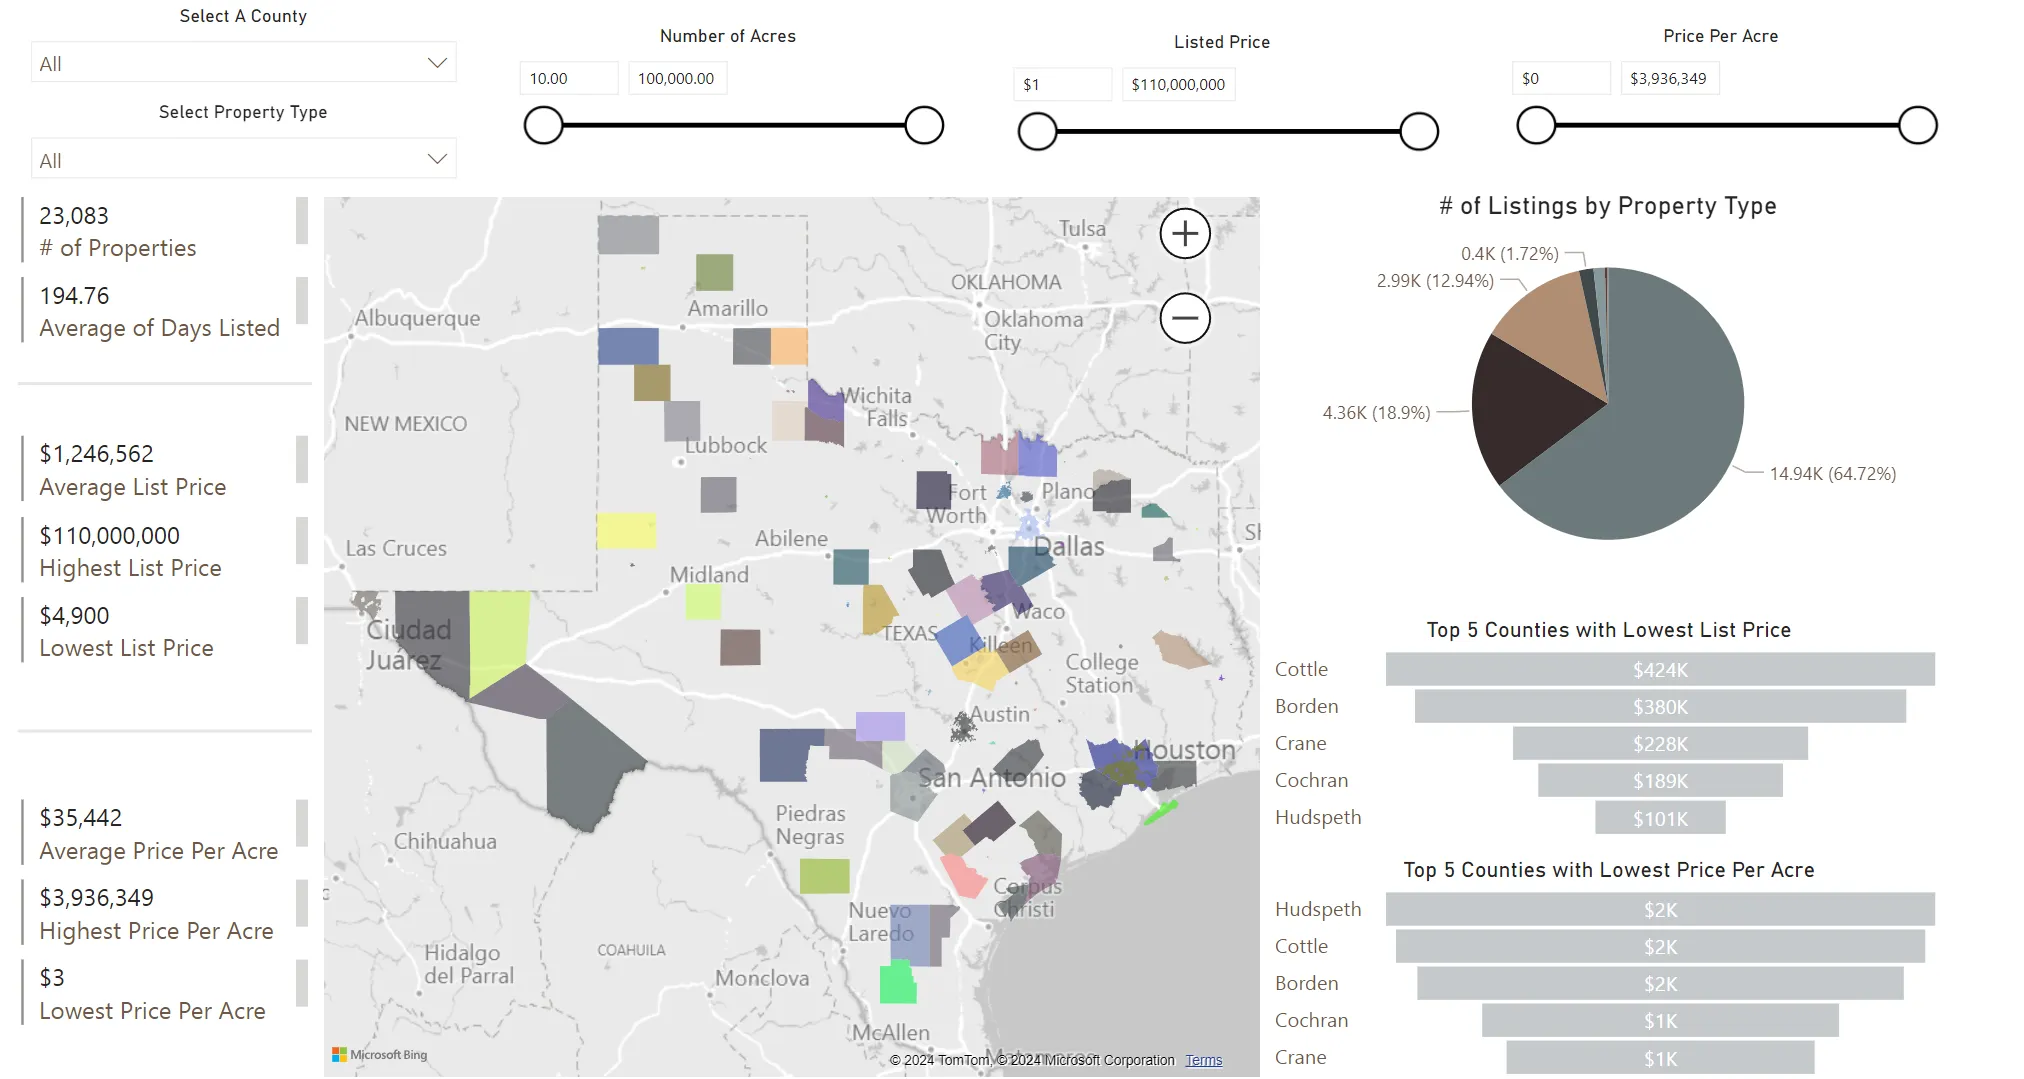
Property listing Dashboard
A dynamic and interactive data-driven visualization platform showcasing real estate analytics, including price trends, acreage distribution, and market insights to assist investors and agents in making informed decisions.
This portfolio project utilizes a comprehensive dataset to present an intuitive interface for analyzing real estate market data. By incorporating key filters, charts, and visual elements, the project enables stakeholders to assess property trends and understand the distribution of various metrics across geographic locations.
Key Features:
- Interactive Charts and Graphs: Including price trends, acreage distribution, and property count per county.
- Advanced Filtering Options: Filter data by property type, price per acre, acreage, and county.
- Responsive Visualization: Dynamic resizing and zoom to focus on key metrics across datasets.
The data model is built to capture relationships between properties, counties, and pricing metrics. Each entity is represented by its distinct dataset, connected through key relationships that enable advanced filtering and aggregation. The model supports various types of queries and visualizations, ensuring flexibility in data analysis.
Average Price Calculation: Computes the average listing price and price per acre across properties.
Top 5 Counties with Lowest Prices: A funnel visualization shows counties with the lowest prices to help identify budget-friendly options.
Property Count: Aggregates the number of properties listed by type and county.
- All property data is synthetic but representative of realistic data.
- Null or missing values for key attributes like price are excluded from calculations.
- Price trends and metrics assume a uniform market scenario without external shocks.

