Hospital Ops Executive Dashboard
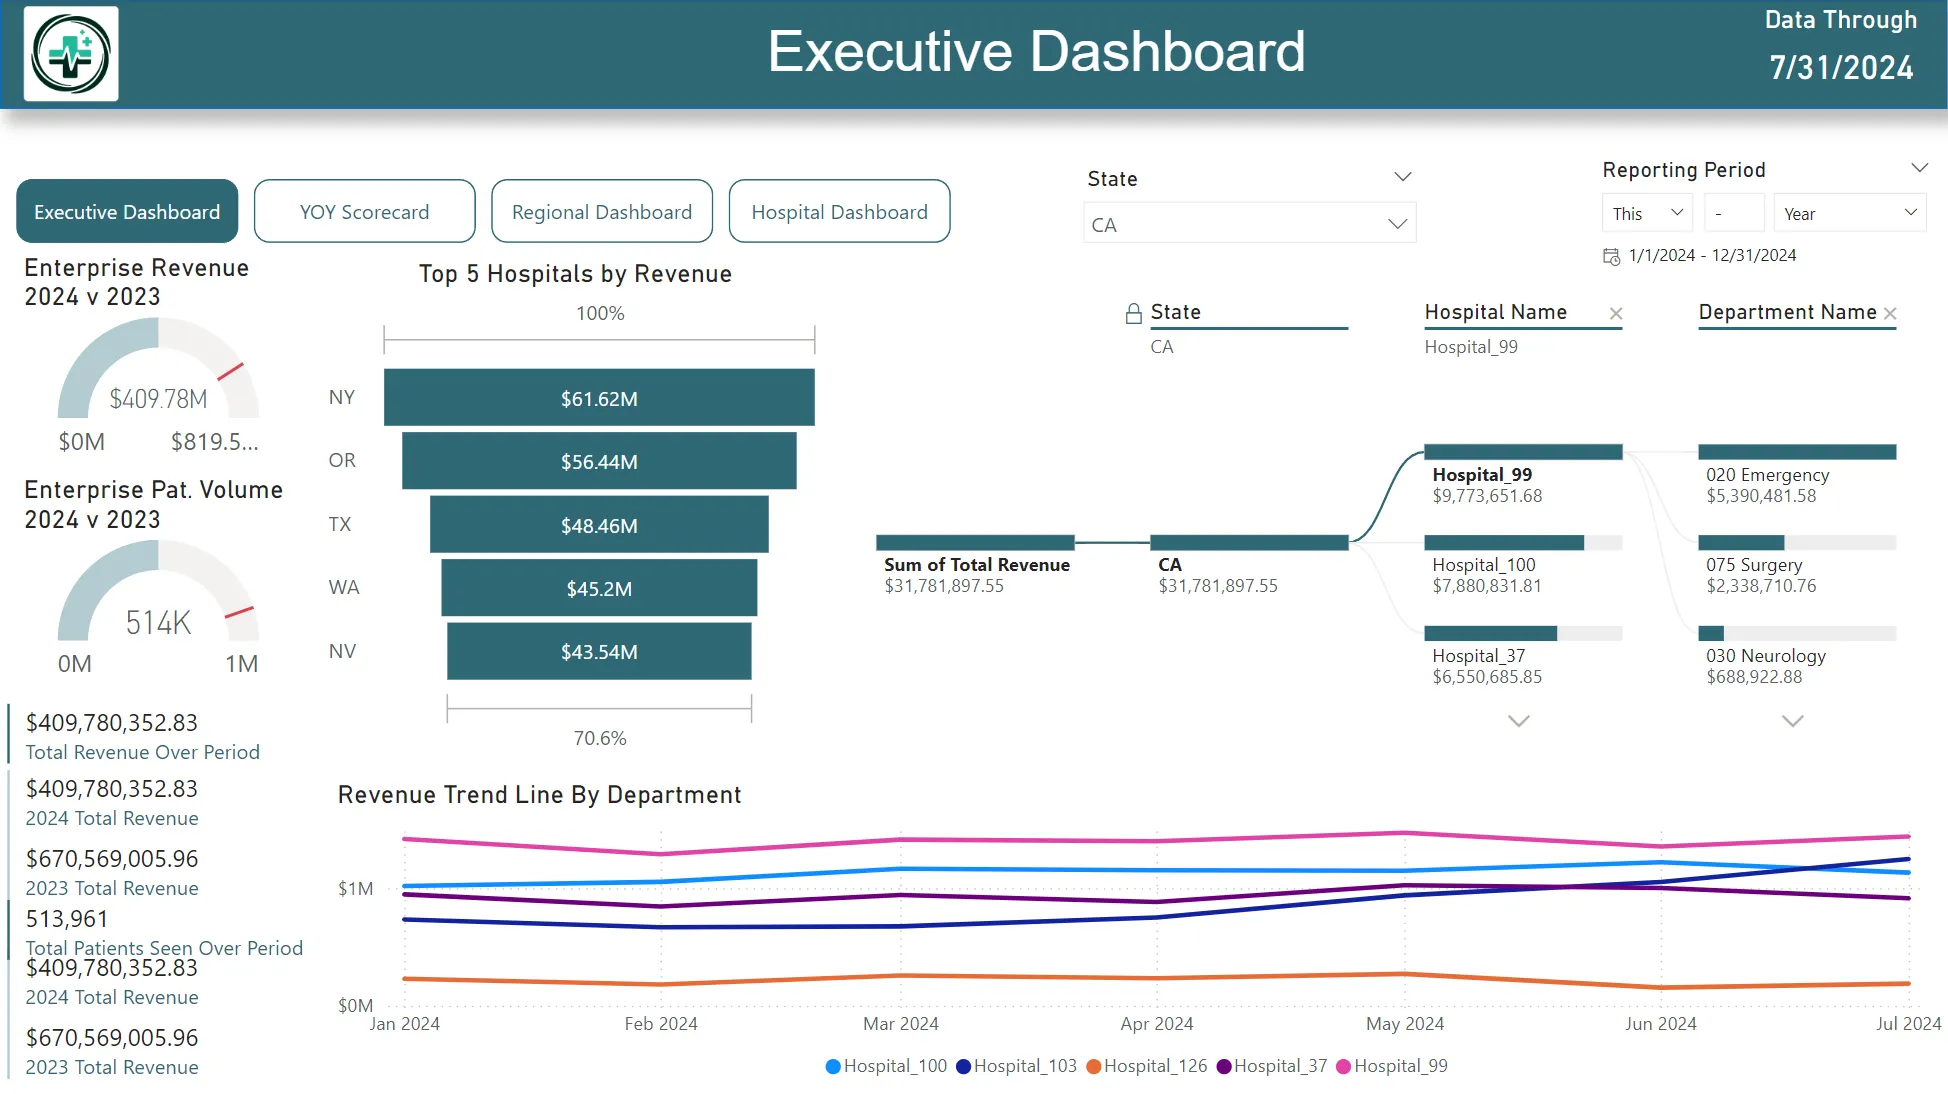
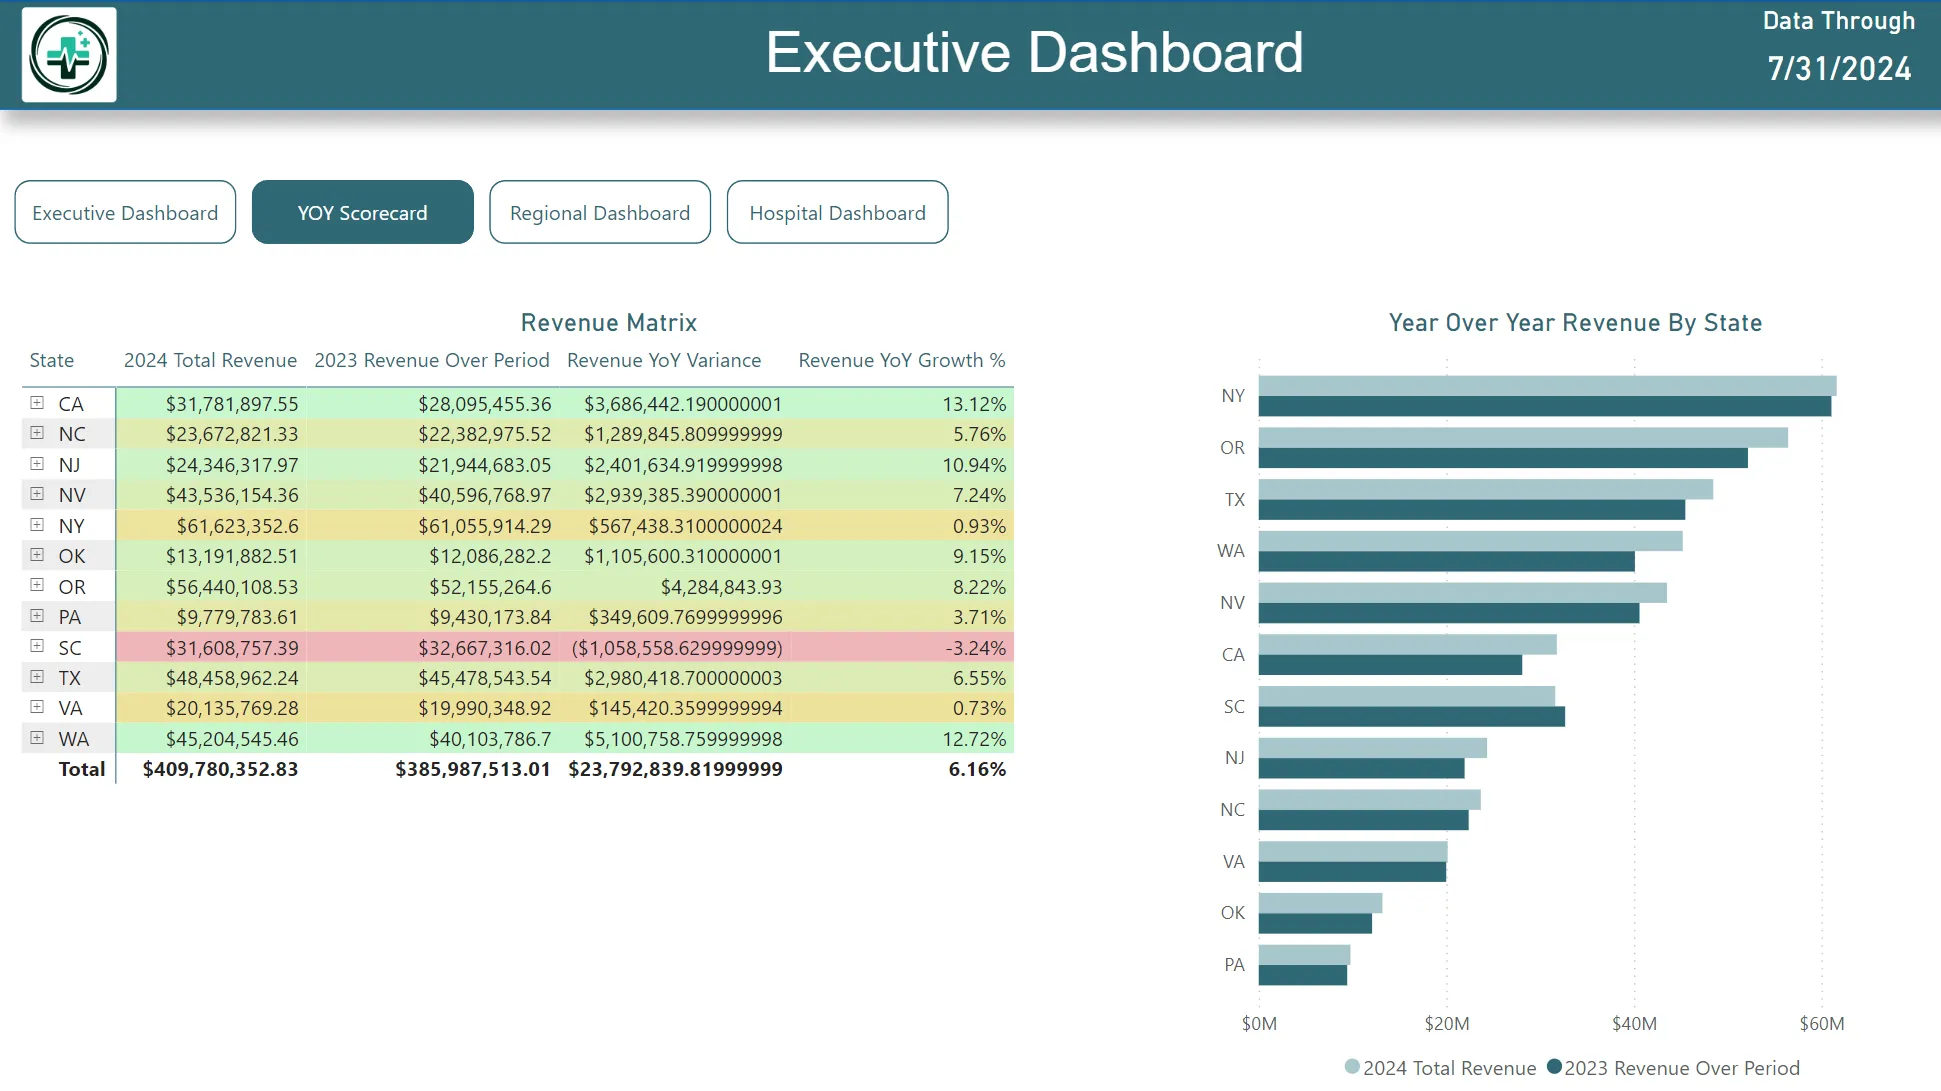
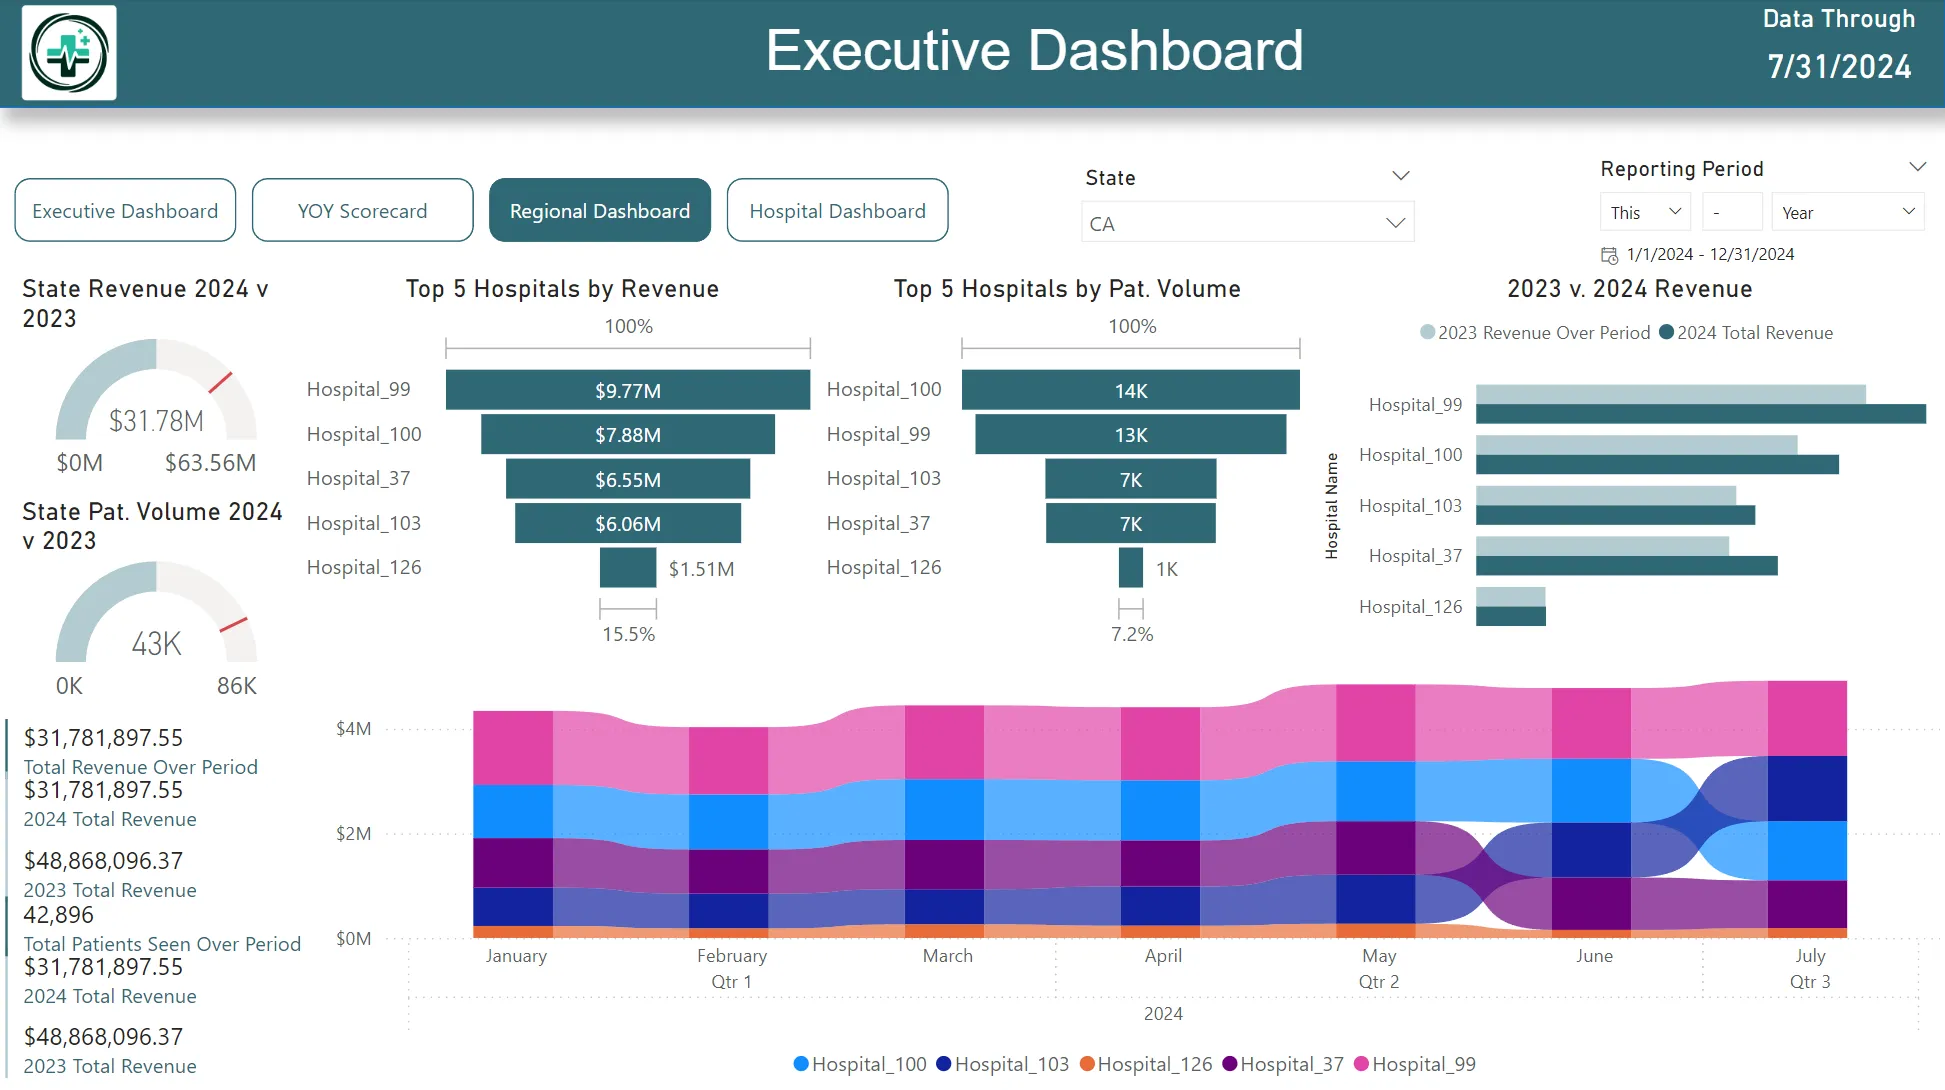
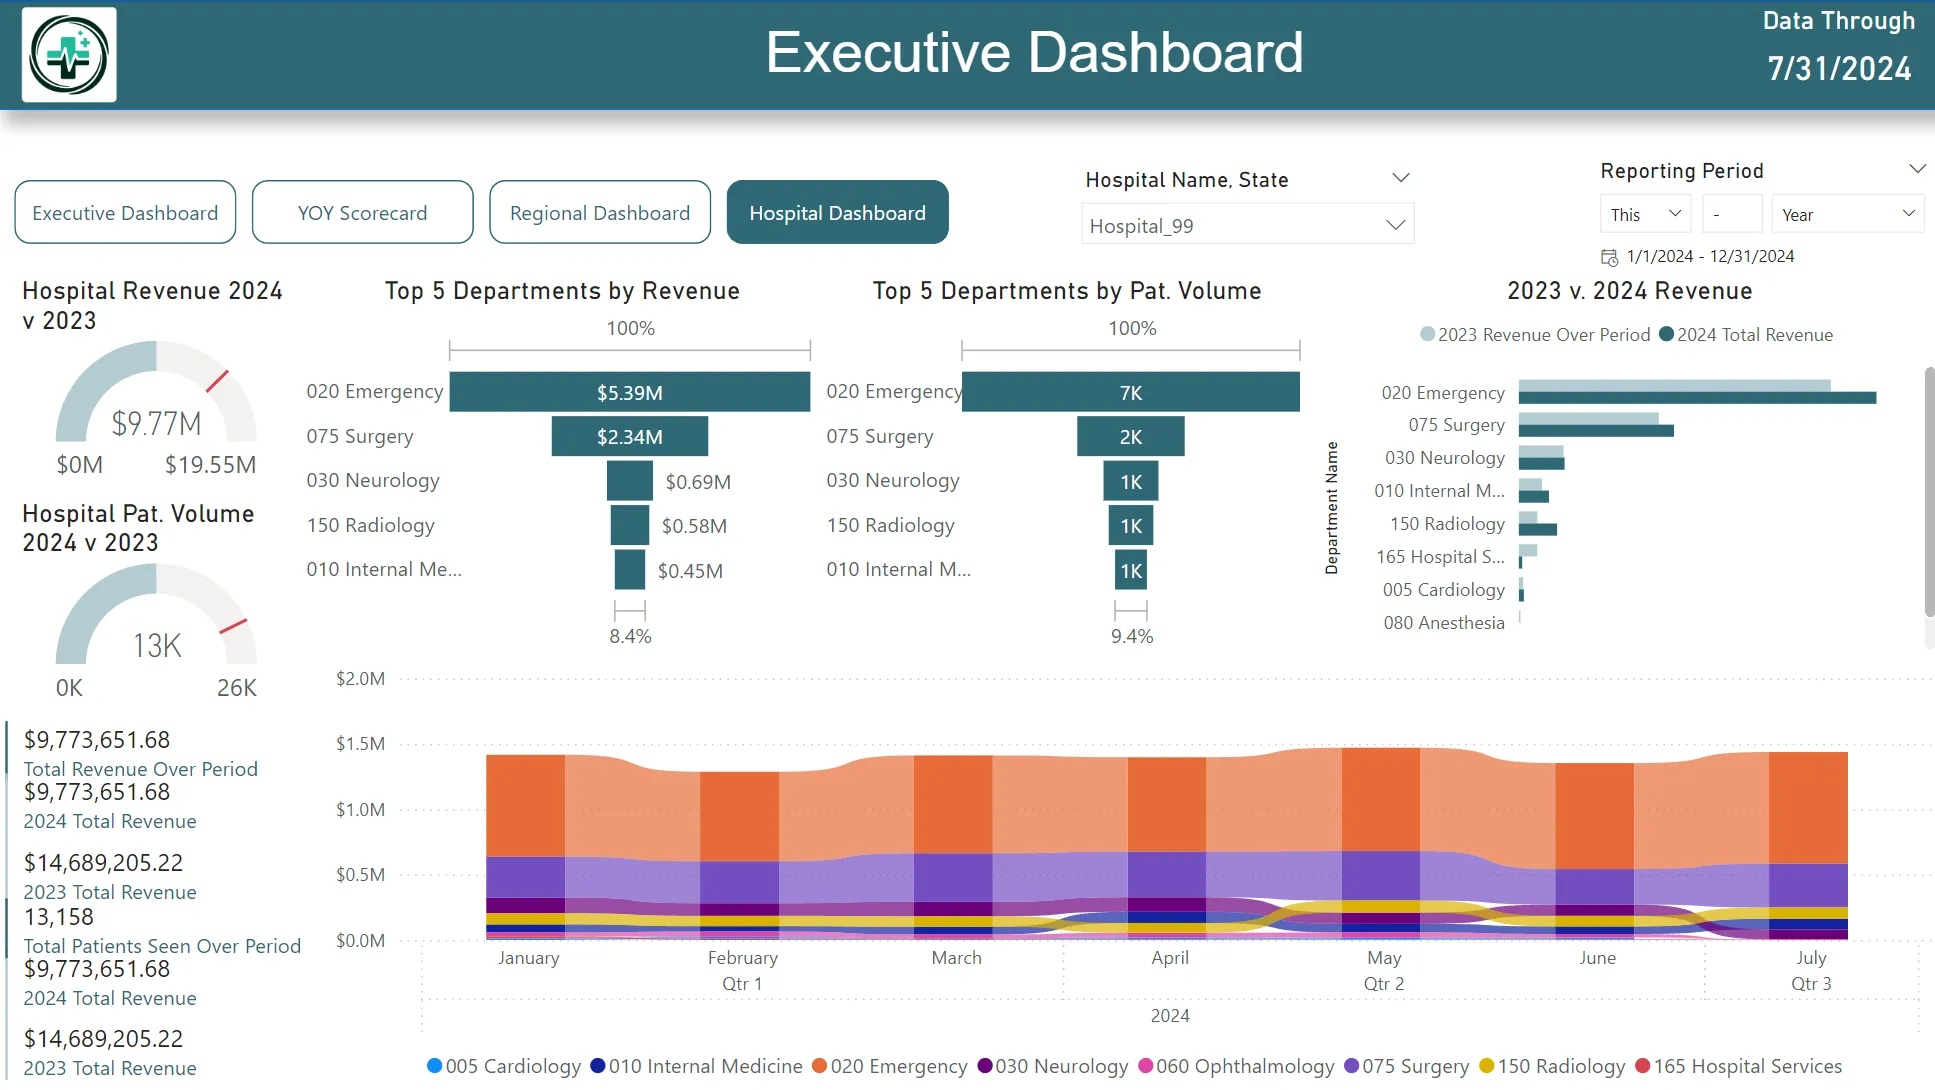
This Power BI project provides comprehensive dashboards designed to offer insights into hospital performance, specifically focusing on revenue and patient volume metrics. The dashboards are intended for executive leadership and hospital management, enabling data-driven decisions across different hospital departments and time periods.
This Power BI project provides comprehensive dashboards designed to offer insights into hospital performance, specifically focusing on revenue and patient volume metrics. The dashboards are intended for executive leadership and hospital management, enabling data-driven decisions across different hospital departments and time periods.
Key Features:
- Executive Dashboard: Offers a high-level overview of key performance indicators (KPIs) such as total revenue, patient volume, and year-over-year comparisons.
- Hospital Dashboards: Provides detailed metrics for individual hospitals, including department-level analysis and trends over time.
- Date Filtering: Integrated a custom date table to facilitate time-based filtering and ensure accurate comparisons between different time periods.
- Custom Measures: Developed using DAX to calculate metrics such as total revenue, patient volume, and year-over-year growth, ensuring insights are both relevant and actionable.
Entity Relationship Diagram (ERD): Modeled the data with an ERD to establish relationships between hospital departments, patients, and revenue tables, ensuring accurate and consistent data representation.
Date Table: Created a dedicated date table to handle time-based filtering and analysis, including the calculation of year-to-date revenue and patient metrics.
Max Date and Month Calculations: Calculated the maximum date for data refresh indicators and the maximum month in 2024 to enable accurate year-over-year comparisons.
Year-over-Year Comparison: Developed measures for comparing 2023 and 2024 revenue and patient volumes, focusing on equivalent periods (e.g., year-to-date comparisons).
In-Power BI Transformations: All data transformations and calculations were performed within Power BI, despite the potential benefits of using SQL or Python for certain operations.
Data Accuracy: Ensured data accuracy by cross-referencing calculated values with the original dataset, providing reliable insights for executive decision-making.
Testing Strategy:
- Data Integrity Verification: Conducted cross-references of calculated values with the original dataset to verify data integrity.
- Dashboard Interactivity: Tested the interactivity and functionality of filters to ensure a seamless user experience.
- Visual Accuracy: Checked that visual representations accurately reflect trends in revenue and patient volumes, making it easier for users to interpret the data.


